A complete toolset for network operations.
Monitoring, alerting, reporting and network insight in a single self-hosted platform.
Network devices
Track the health and performance of switches, routers, firewalls and access points.
- SNMP v2c and v3 (SHA-256 and AES)
- Interface traffic, errors and status
- CPU, memory, disk and process checks
- Restart detection from device uptime, even between checks
- Vendor templates for Dell, HPE, FortiGate, Synology, QNAP, UPS units and printers
- Firewall profiles for Palo Alto, Check Point, Cisco ASA and Firepower, SonicWall, Sophos, WatchGuard and Juniper SRX (beta)
Servers and virtualisation
Monitor servers and hypervisors without installing agents.
- Linux health and systemd services over SSH
- Linux health over SNMP (net-snmp)
- A ready-made Linux server (SNMP) template for every new Linux server: ping, plus uptime, CPU, memory and disk space once it has an SNMP login, with alerts over 90%. The server’s page gives the snmpd set-up commands to copy.
- Windows health, services and performance counters over WinRM
- VMware vCenter and ESXi hosts, VMs and datastores
- Hyper-V hosts and virtual machines
- Proxmox Datacenter Manager, with every node, virtual machine and storage of each remote monitored automatically
- Proxmox VE, XCP-ng, Citrix Hypervisor and Nutanix (beta)
- oVirt, Red Hat Virtualization, Virtuozzo, IBM PowerVM and HPE Morpheus (beta)
- Veeam Backup & Replication jobs and repositories, and Redstor backups (beta)
Applications and services
Detect outages in the services your users depend on.
- HTTP and HTTPS checks
- Multi-step web transactions, including sign-in
- TLS certificate expiry and trust
- DNS records and TCP ports
- SMTP, IMAP and POP3 mail servers
- SQL Server, MySQL and PostgreSQL, with Oracle Database (beta)
- Metrics from your own applications with OpenTelemetry (OTLP over HTTP) and an Operator API key, each series a sensor with history, threshold rules and alerts
Cloud and Microsoft 365
Monitor hosted services alongside your on-premises estate.
- Azure monitoring
- AWS monitoring
- Microsoft 365 service health
Traffic, logs and traps
Understand bandwidth consumption and the events your devices report.
- NetFlow, IPFIX and sFlow traffic summaries
- Ready-made commands to send flows from each router, switch or firewall
- Syslog and SNMP trap reception
- Event rules that turn messages into incidents
- MIB library for named OIDs and traps
Custom sensors
Extend monitoring to systems that no product supports out of the box.
- Values from any REST API
- Scripts over SSH or PowerShell
- Compatible with Nagios plugins
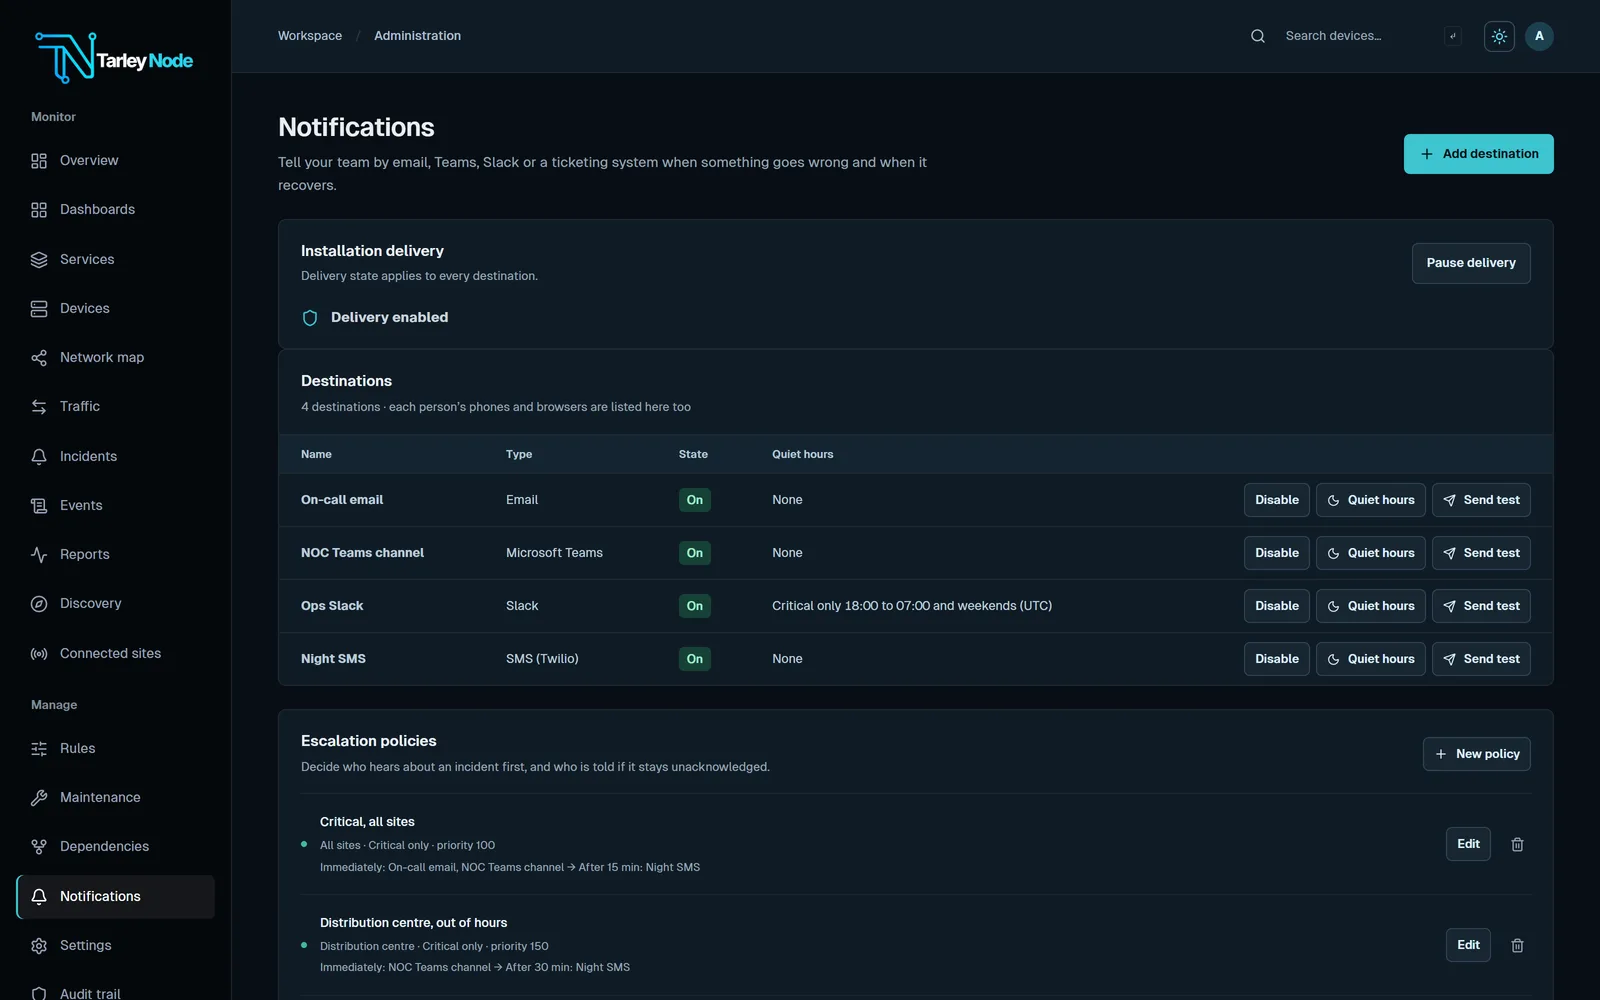
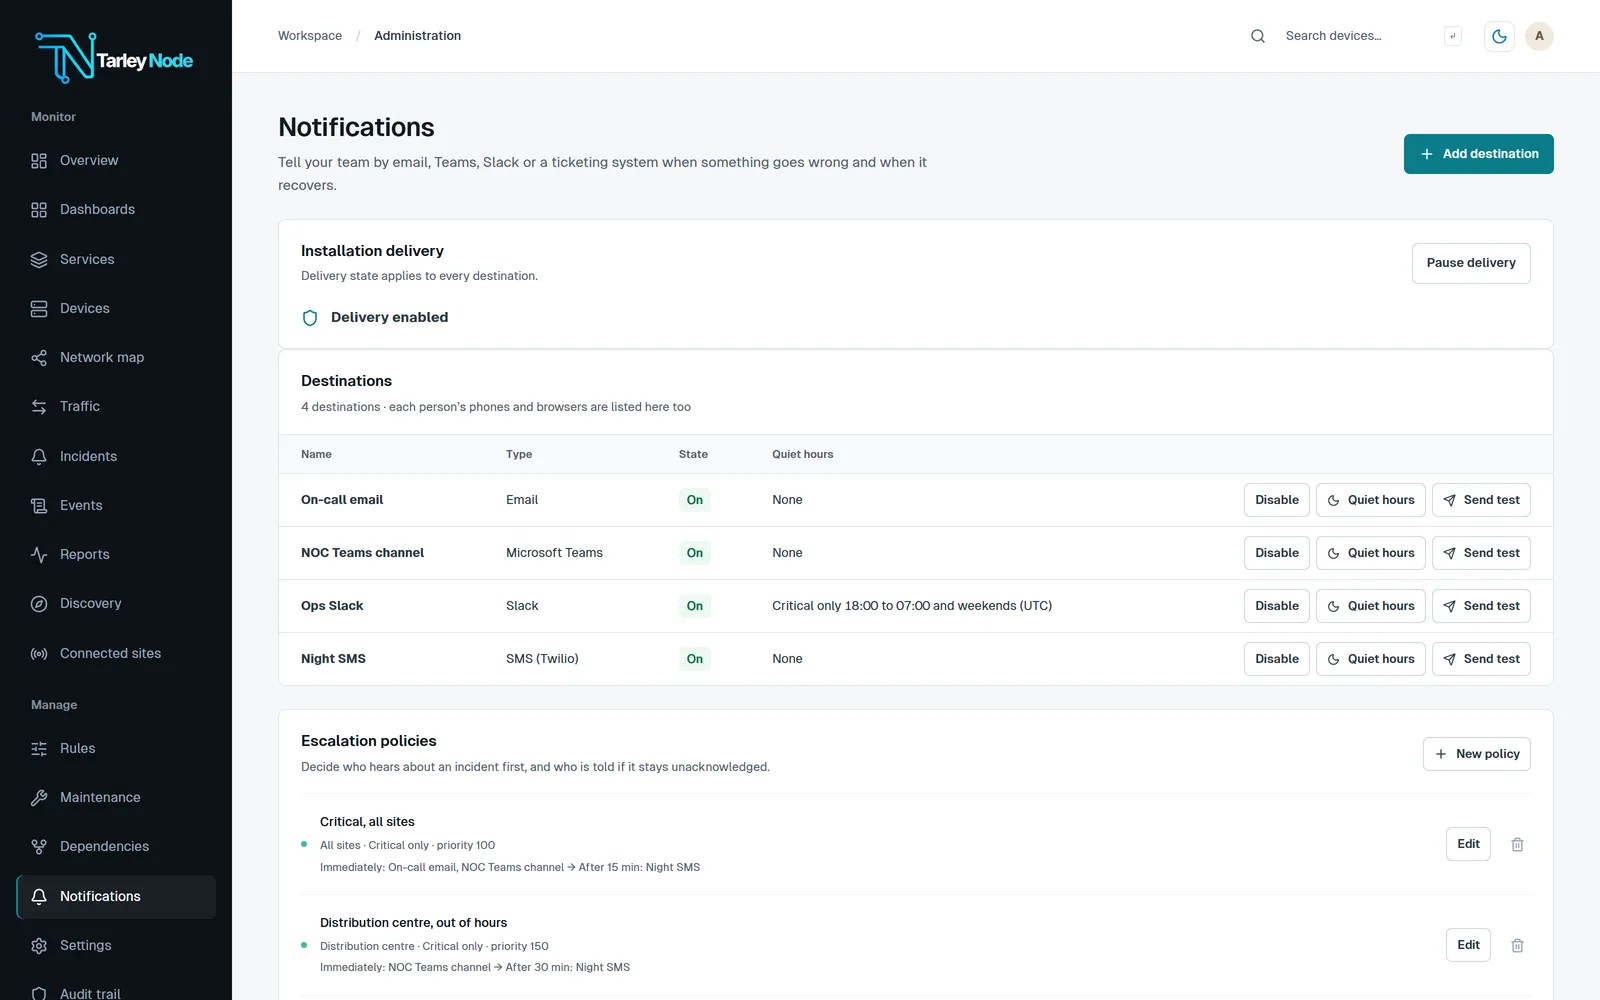
Alerts and escalation
Notify the right person, and escalate automatically when an alert is not acknowledged.
- Thresholds, hysteresis and consecutive-failure rules
- Escalation policies by site and severity
- Email, Teams, Slack, Google Chat, PagerDuty, Telegram, SMS (Twilio or your own provider), Jira, ServiceNow and webhooks
- Desktop alerts in Chrome, Edge, Brave and Firefox
- Acknowledgement, dependencies and maintenance windows
Dashboards and status pages
Provide the right view for every audience.
- Saved private and shared dashboards
- NOC wall display with links for screens
- Public status pages
- Business services with their own status and alerts
- A Grafana data source: a read-only, Prometheus-compatible endpoint signed in with an API key
Reports
Demonstrate how the network has performed.
- Availability and incident reports with CSV export
- Custom PDF reports with a sensor availability table
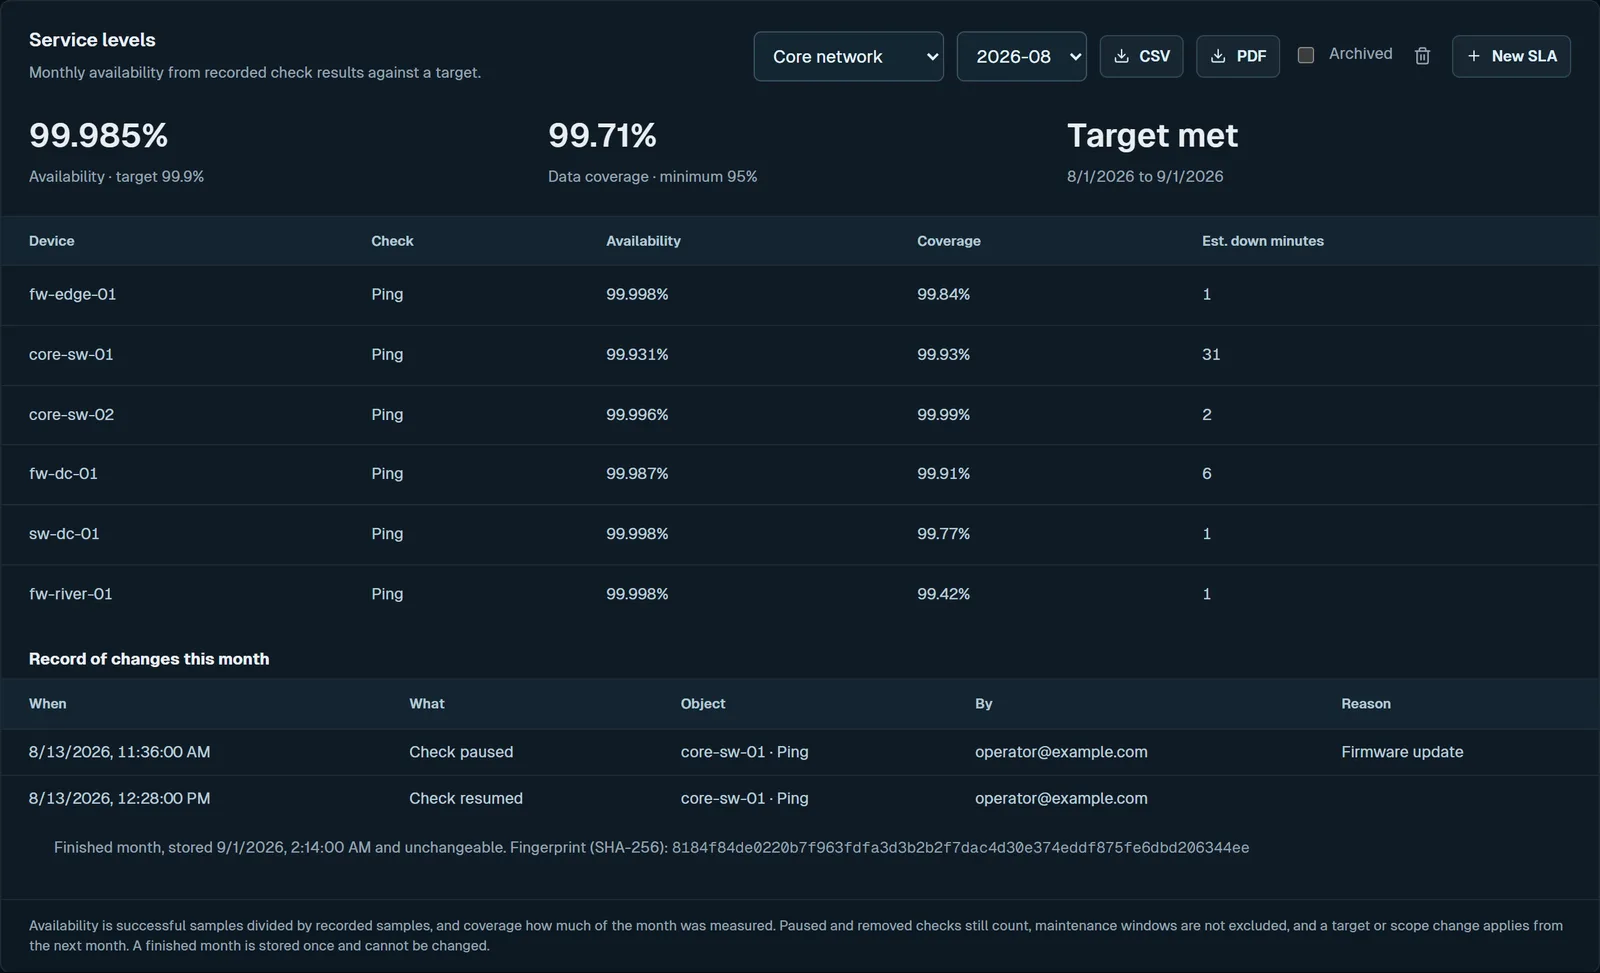
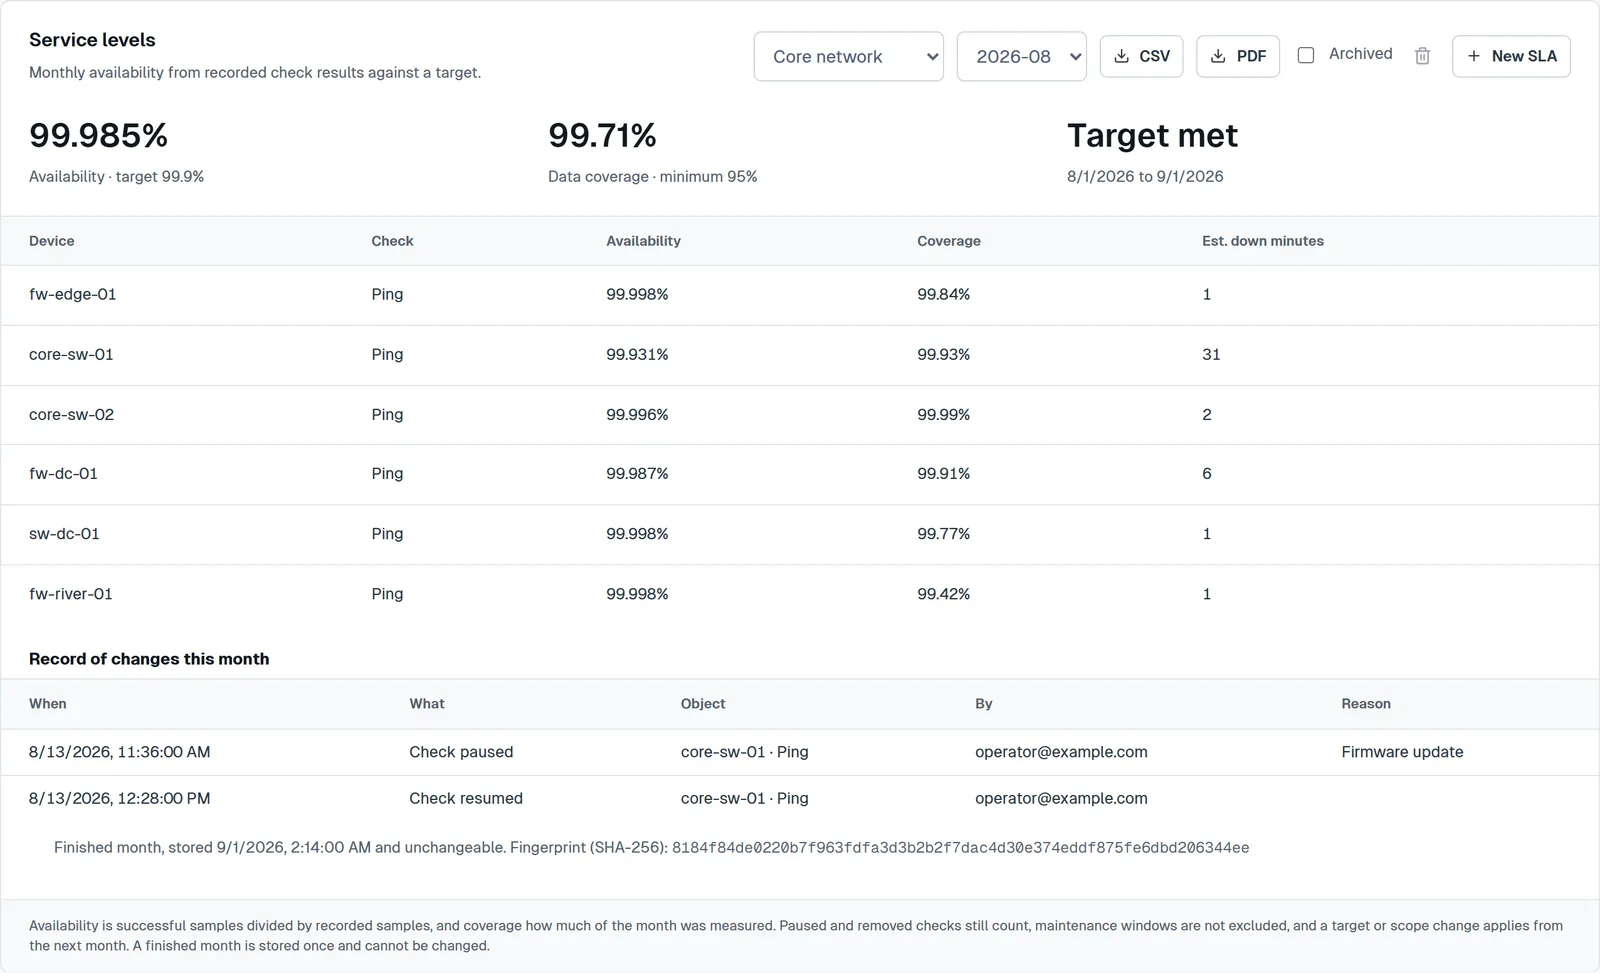
- Monthly service-level reports that cannot be changed afterwards, with a SHA-256 fingerprint
- Scheduled daily, weekly or monthly reports by email or webhook
- Measurement history for every check, with graphs from 1 hour to 1 year or a custom range
- Drag across a graph to zoom in, with alert limits as dashed lines, a 95th percentile line on port traffic, and PNG and CSV export
Network insight
Understand how your infrastructure is connected.
- LLDP and CDP network map
- Switch port mapper
- Configuration backups over SSH with change history
- Discovery scans for each site
- Devices followed to their new address when DHCP moves them
Scale and operations
Manage large device estates across multiple sites.
- Connect additional sites on Linux or Windows
- Device templates and reviewed bulk editing of checks
- One check interval for a whole device, such as 15 seconds on a core switch
- High availability with automatic failover
- Backup and guarded restore
Access and automation
Give every user precisely the access they need.
- Administrator, operator and viewer roles
- Groups that limit viewers and operators to chosen device categories
- The console installs as a desktop app in Chrome, Edge and Brave
- Single sign-on with OpenID Connect or Microsoft
- Two-step sign-in with an authenticator app
- API keys with a guide of worked examples, and a searchable audit trail